Climate Crisis Response Strategy: Carbon Monitoring
Details
As part of our Climate Crisis Response Strategy, UWC RBC has begun measuring its greenhouse gas emissions, in order to guide our reduction efforts as well as our offsetting spendings.
As climate change is one of the central issues in achieving a sustainable future, it is important to understand our own contribution to the problem – both to try and reduce the problem and to educate students about which aspects and behaviours have the largest impact.
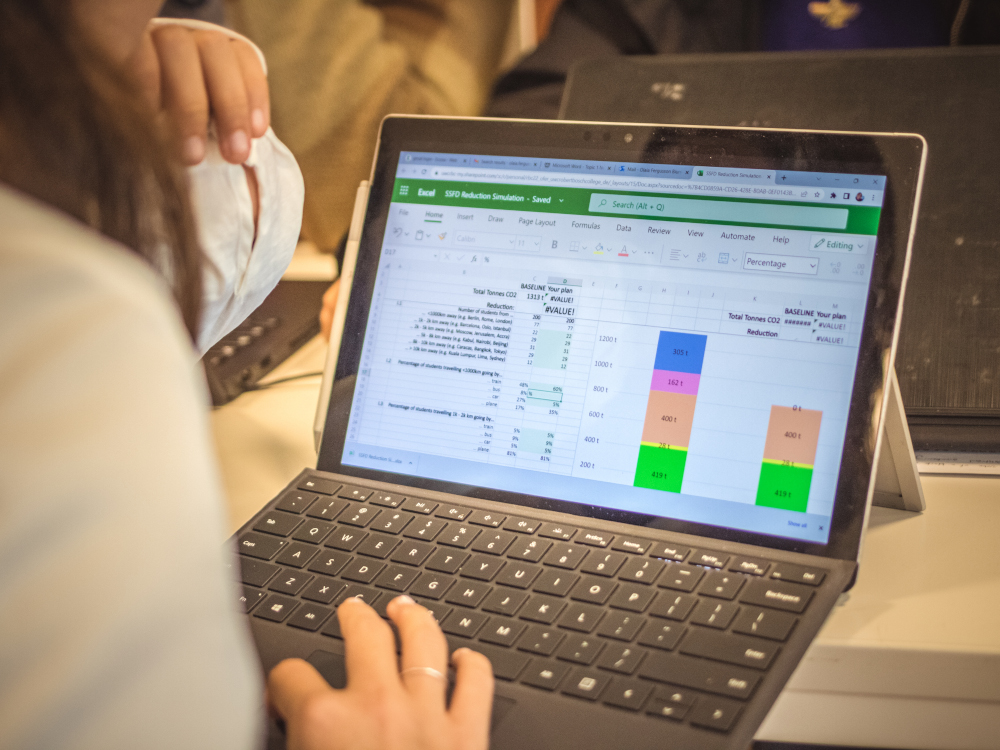
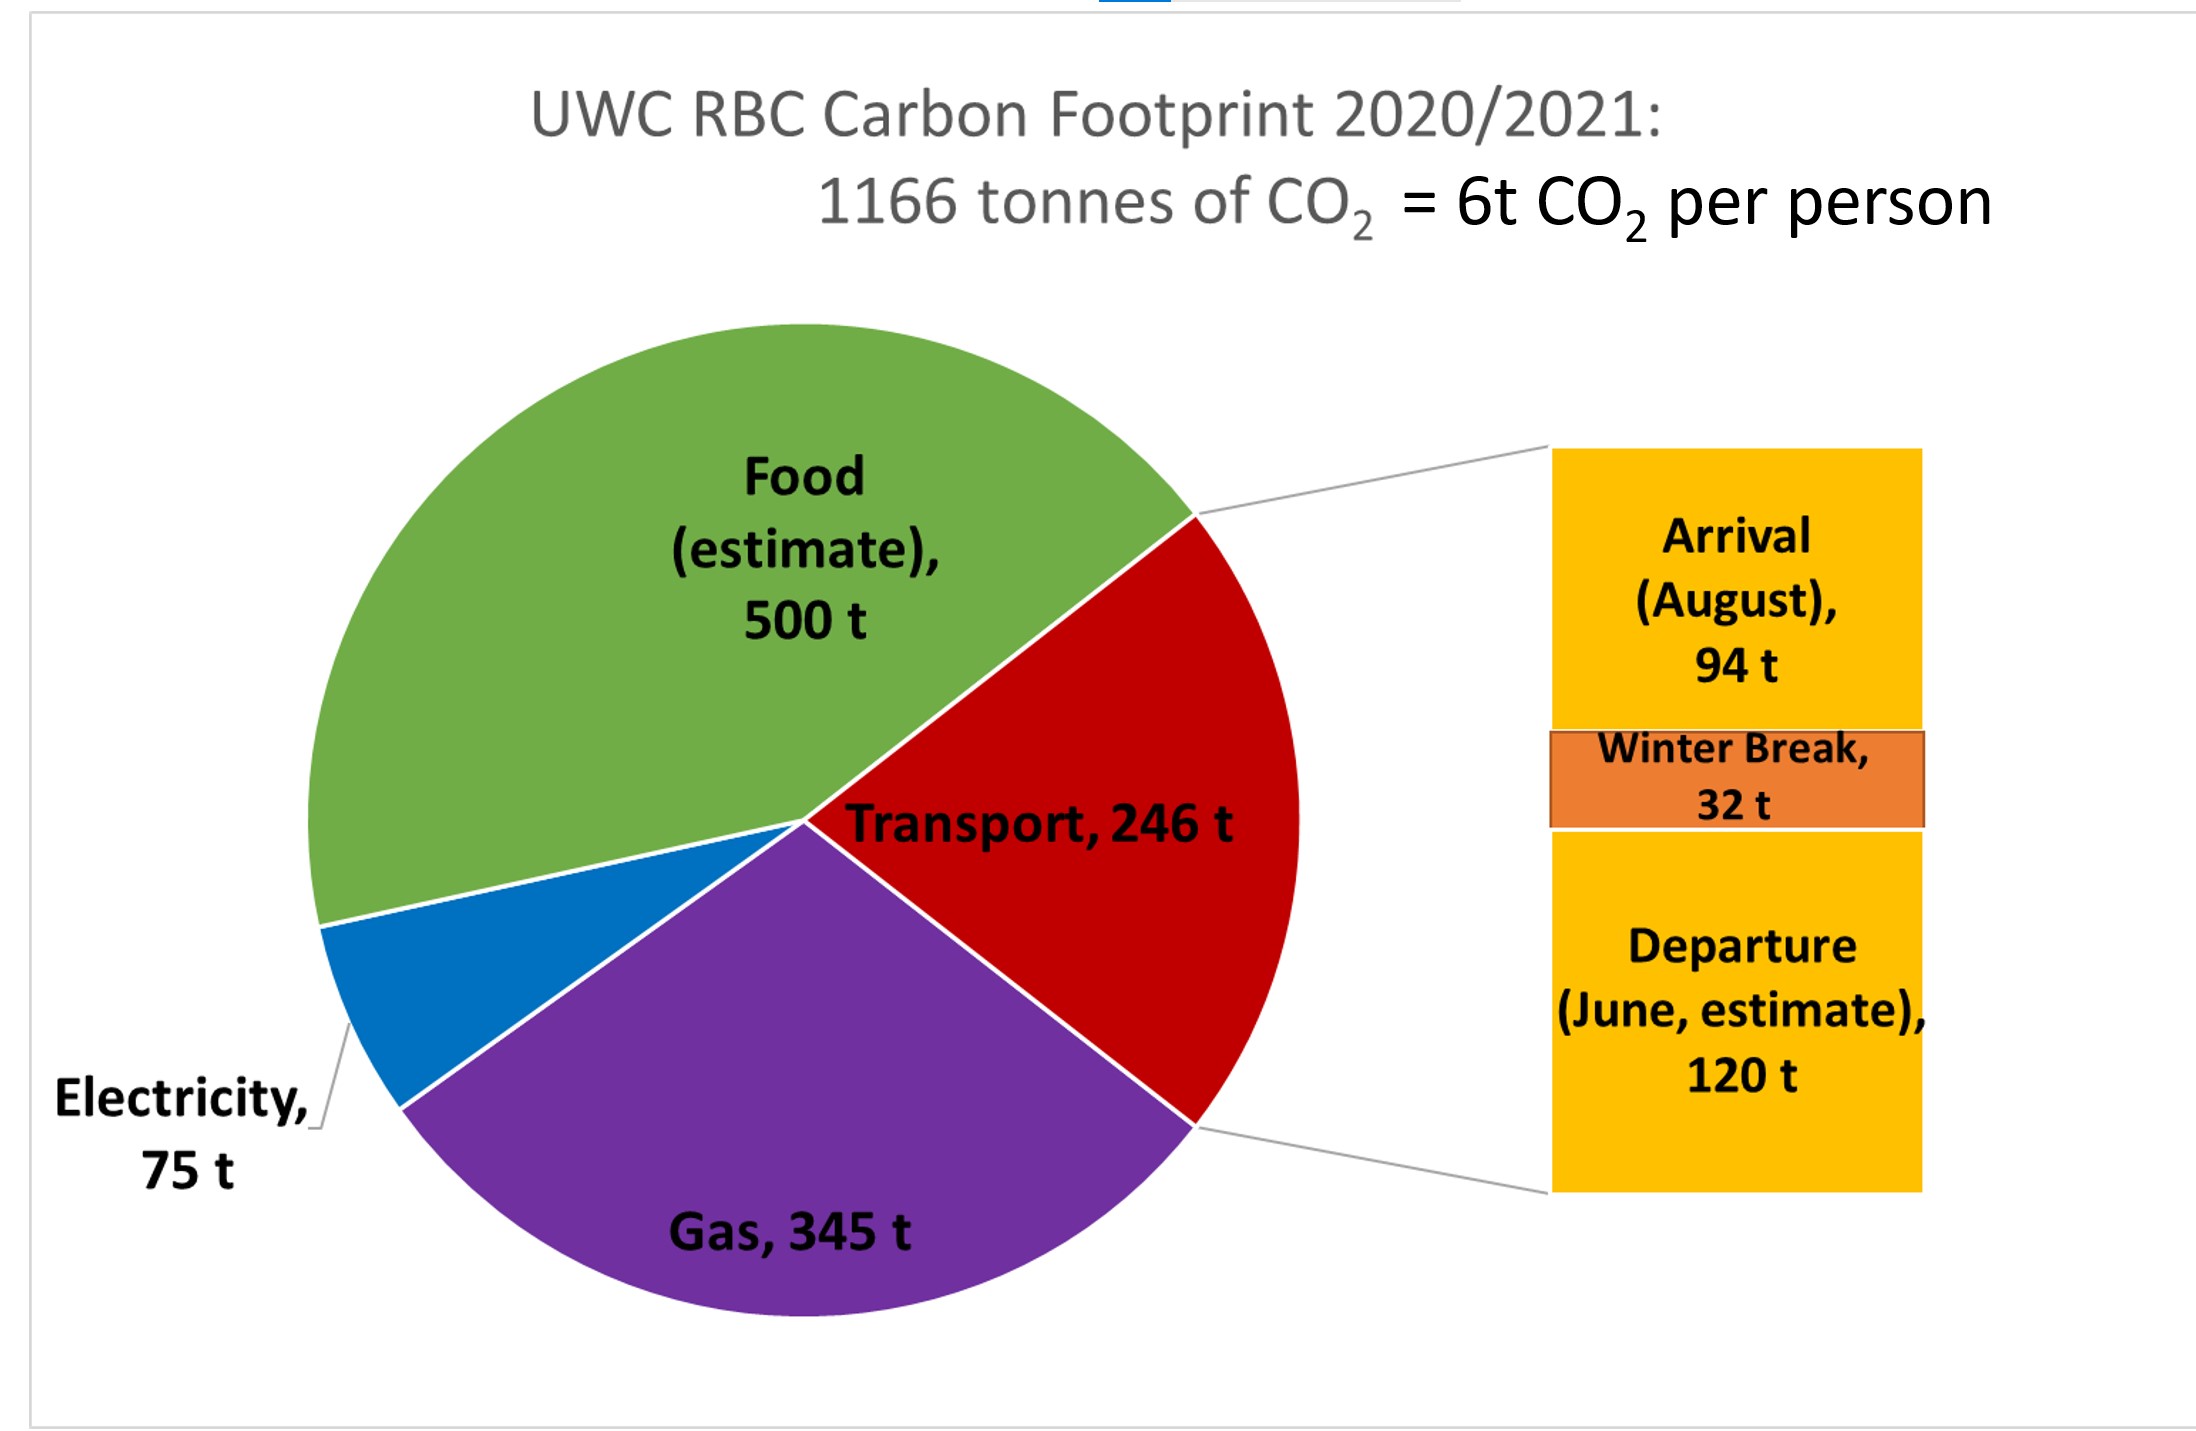
A large number of factors contribute to an institution’s climate impact. At RBC, we currently monitor three areas which we believe together account for most of our footprint: Use of gas and electricity, travel to and from the school, and food provided by our mensa. Calculating the impact of gas, electricity and transport is reasonably straight-forward and we have a high degree of confidence in our numbers. Quantifying the impact of food has proven trickier; we see our current figures as rough estimates as we improve our methodologies.
Our figures for 2021/22 add up to around 1,200 tonnes of CO2-equivalent. With a little more than 200 students and staff living on campus, this works out to around 6t per person – already higher than the global per-capita average of around 4.5t per person. It’s to be noted that our figures do not yet account for things such as consumerism and waste. This makes it abundantly clear that we are currently very far away from where we need to be – according to scientists, if we want to limit to 1.5°C, the global per capita emissions need to sink to 3t by 2030 and 1t by 2050.
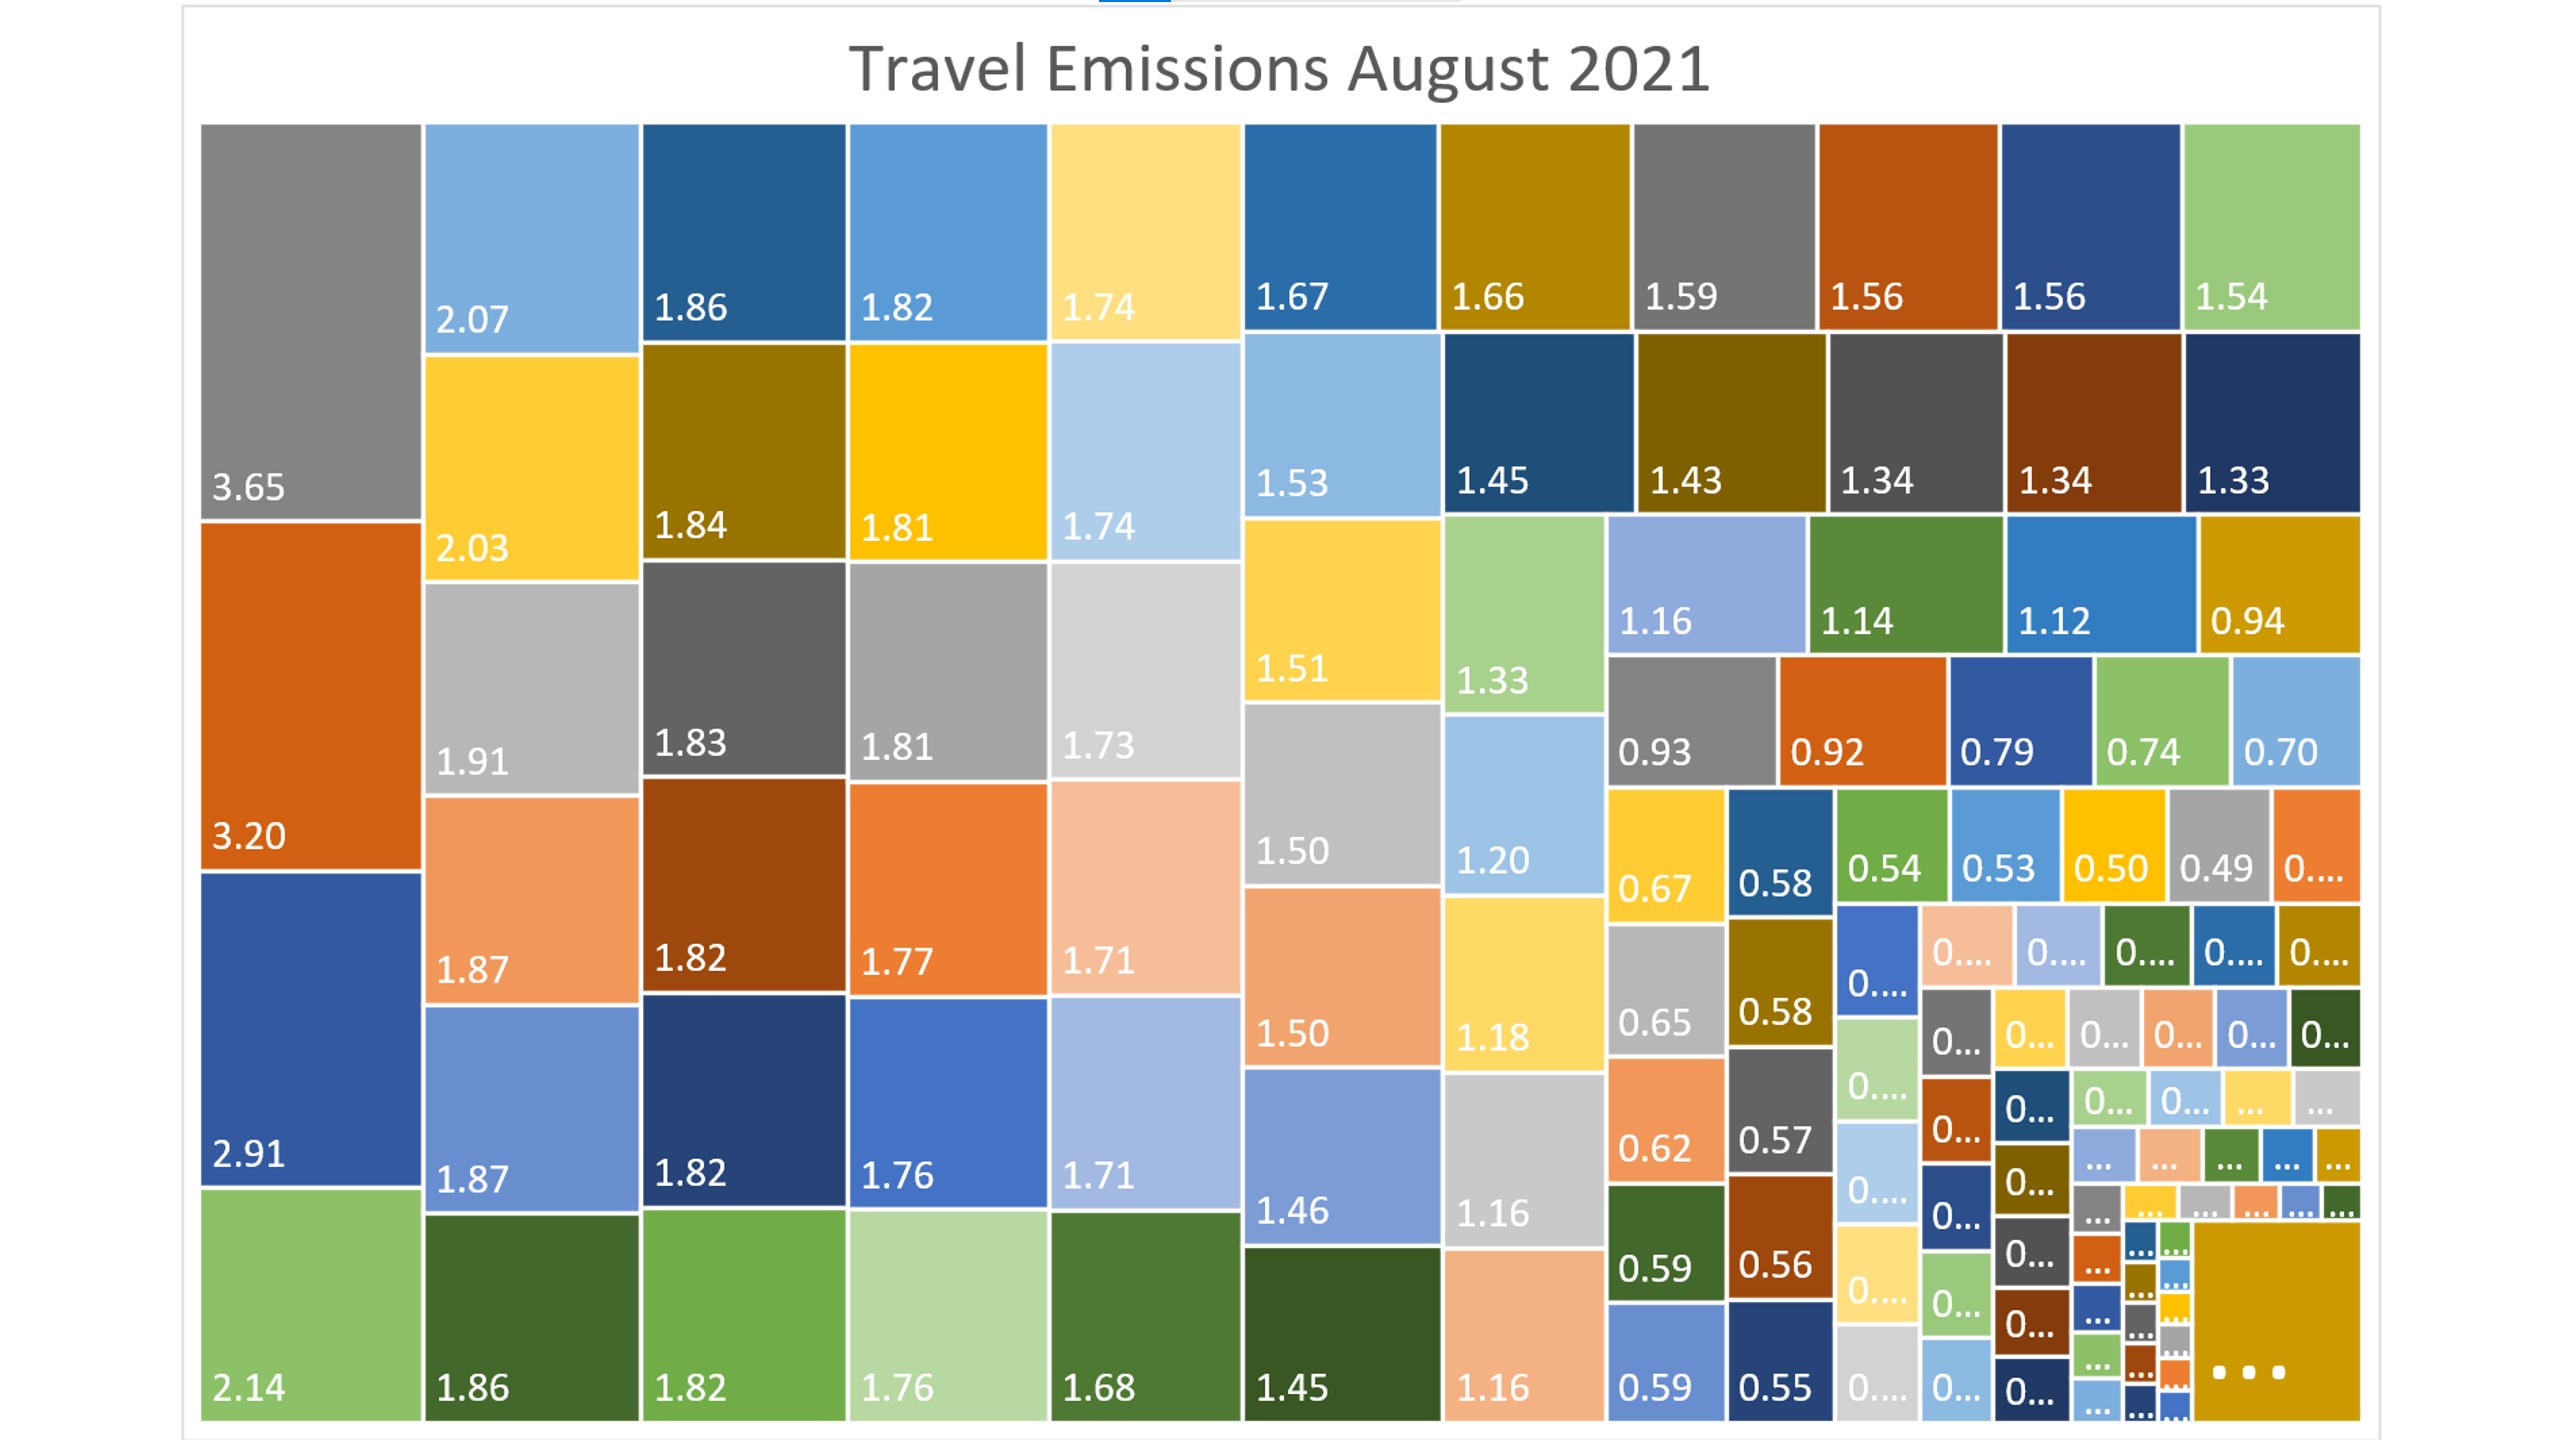
Currently, alone the travel to RBC in August and back in June adds up to more than 1t per student, with 29 students accounting for 50% of total travel emissions – whereas the 100 students and staff with the shortest travel distances together only caused 10% of the emissions associated with travelling to and from RBC. Talking about the massive climate impact of flying in ways that do not downplay the issue but also do not make individuals feel ashamed for coming to our school is the biggest challenge in communicating results to our students. However, the data collection project also allows us to identify “low hanging fruits” for partially addressing the issue: Due to travel restrictions, during the winter break in 2020/21 most students stayed on campus or in Europe. This brought down emissions by more than 100t compared to the year before – an insight that has started a discussion about encouraging students to stay in Europe over the winter break.
UWC RBC has a cooperation with the High Atlas Foundation (HAF), an NGO in Morocco that helps local communities in the High Atlas mountains to plant fruit and nut trees. Every year we pay HAF to plant enough trees to eventually absorb the amount of CO2 emitted by RBC in that year, and we are planning to develop a summer course on ecological restoration based on this cooperation.
We are also working together with staff from other UWCs to develop tools and recommendations that allow every school and college to measure their climate footprint, turning this into something we do across the whole UWC movement.
Hands-on example:
Sand Bottles: Visualizing environmental footprints
By filling different amounts of coloured sand – representing different categories of environmental impacts such as transport, food, energy and consumerism – into transparent water bottles, members of the community are invited to visualize and share their local environmental impact (in their home country). In the past, this hands-on visualization of impacts has been the starting point of many interesting discussions and personal reflections.